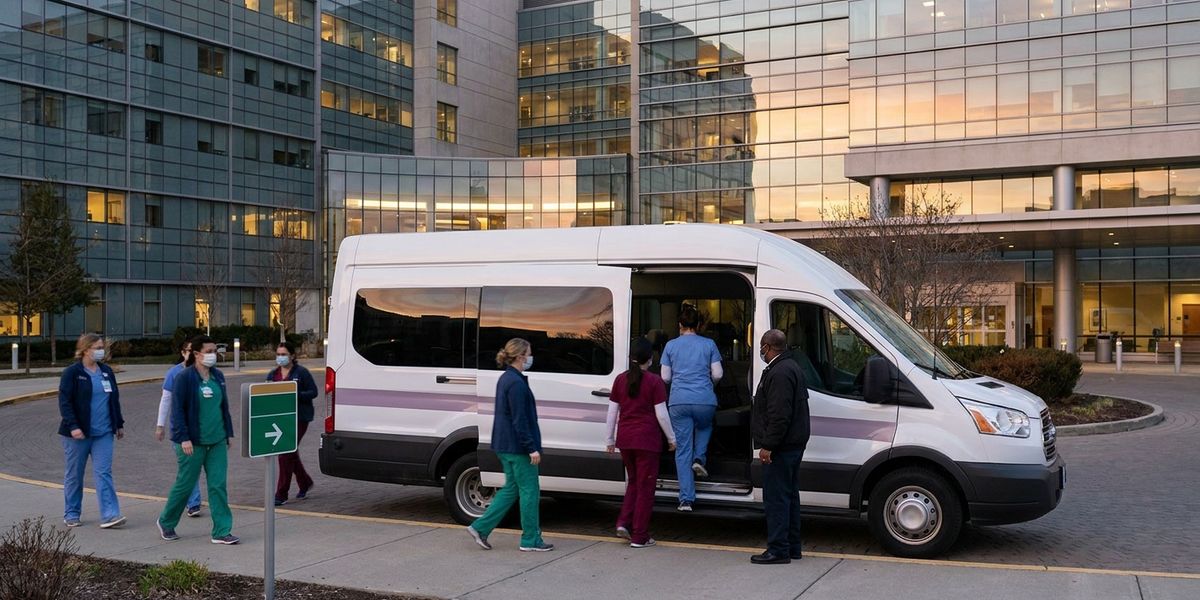
A float-pool nurse who covers three campuses in one health system does not have one commute. She has three, and the one that ends a 7p-to-7a shift at 7:30 on a winter morning is the one that should worry the operations office most. Most staff-transport plans never see it, because they were built around a 9-to-5 parking peak that her roster ignores.
This guide is for VP-level Operations, Facilities, and Support Services leaders, and for the Chief Nursing Officer’s staffing office, at health systems running two or more hospital campuses plus ambulatory sites. The decision it walks through is narrow and operational: how to align vehicle dispatch windows to the real shift-change clock across every campus, route the nurses who rotate between sites, and treat the night-shift drive home as a retention line item rather than a wellness footnote. The retention stakes are concrete. A nurse-recruitment firm’s national survey puts the average cost of replacing one bedside RN at over $60,000, and the research on post-shift drowsy driving is worse than most administrators assume.
What this guide does not cover: patient and non-emergency medical transport (a separate regulated service), executive travel, or the full RFP scoring rubric for a transport vendor. It stays on the staff-commute problem that a multi-campus structure makes genuinely hard.
Why a multi-campus structure turns the commute into an operations problem
The single-hospital staff shuttle is a solved problem: one lot, one or two doors, a loop that runs on a fixed headway. A health system is a different animal. The American Hospital Association counts 404 US health systems in its FY2022 Annual Survey, and reports that 4,163 of the country’s 6,120 hospitals (about 68%) sit inside one of them; system-affiliated facilities hold 77% of all US hospital beds. Systems range from 1 to 155 hospitals, the AHA found. The multi-campus operator runs most of the inpatient map, not the edge of it.
That structure breaks the assumptions a single-site shuttle rests on. Staff do not all report to one address. A med-surg RN may be fixed at the flagship campus while the float pool, the per-diem nurses, and the travelers rotate across two, three, or eight sites in a single pay period. A vehicle plan that drops everyone at the main entrance of the largest hospital strands the nurse who is needed at the satellite campus 14 miles away tonight and back at the flagship on Thursday.
One reframing matters above the rest: the vehicle has to follow the roster, not the road. A commute plan keyed to where the buildings are will optimize for the wrong thing. A plan keyed to where the staff are scheduled to be, and when is the only version that survives contact with a real nursing schedule.
There is a second-order reason multi-campus systems should care more, not less, about this. They are competing for the same scarce labor pool across all their sites at once. The American Association of Colleges of Nursing, drawing on Bureau of Labor Statistics projections, sizes the RN workforce at roughly 3.1 million in 2022 and projects about 193,100 RN openings every year through 2032 as nurses retire and the population ages. HRSA’s workforce model, cited in the same AACN fact sheet, projected a full-time RN shortfall in the tens of thousands across the mid-decade. When the labor market is that tight, a system that loses a night nurse at its hardest-to-staff campus is not refilling that seat from a queue. It is recruiting against every other hospital in the region.
Map the real shift pattern before you map a single route
The most common planning error is upstream of routing entirely: teams design the schedule of the vehicle before they have looked at the schedule of the roster.
Start with the dominant pattern. The American Nurses Association describes the typical hospital nurse schedule as either 7am to 7pm or 7pm to 7am, three twelve-hour days a week. That single fact reshapes the whole transport problem. Shift changes do not happen at 9am and 5pm. They cluster in two tight bands around 6:30 to 7:30 in the morning and 6:30 to 7:30 in the evening, when the off-going and on-coming shifts overlap for handoff. A shuttle tuned to an office commute peak misses both. It arrives after the 7am crowd has already given up and driven, and it has gone home long before the 7pm inbound nurse needs it.
Then layer the units that do not run on 12s. Eight-hour units, many outpatient and procedural areas, and some support departments still run the classic three-shift clock at 7a, 3p, and 11p. Emergency departments and ICUs frequently stagger their start times to keep coverage smooth across the handoff, so a campus can have nurses arriving and leaving at 7a, 11a, 3p, 7p, 11p, and 3a on the same day. The histogram of arrivals and departures at a busy campus is not one peak or two. It is a comb.
A worked version makes the point. Pull the actual scheduling export for one campus for a representative two-week period and bin every shift start and end into 30-minute buckets. Most operations leaders who run this exercise find their two largest buckets are 06:30–07:00 and 18:30–19:00, with a meaningful third spike at 22:30–23:00 from the 11p eight-hour starts and a long, thin tail of off-hour ED and ICU arrivals. Once you can see the comb, the transport question answers itself: dispatch windows have to sit on the teeth, not on the office mean between them.
One caveat worth stating plainly. The exact off-hour stagger varies by system and by unit, and there is no clean national dataset of US 12-hour-shift prevalence by hour. Build the histogram from your own scheduling system rather than from a generic template. The 7a/7p backbone is reliable; the precise position of your off-hour teeth is local data only your roster holds.
The night-shift drive home is the retention risk hiding in plain sight
Here is the figure that should anchor the business case, and it is not the one that circulates in trade decks. The foundational study is Scott and colleagues’ four-week logbook and actigraphy work on 895 full-time hospital staff nurses, published in SLEEP. It found that 66.6% of the nurses reported at least one episode of drowsy driving during the study period. Among nurses who worked only night shifts, that figure climbed to 79.5%. Three percent reported drowsy driving after every single shift they worked.
That same dataset records how deep the fatigue runs before the drive even starts. The American Academy of Sleep Medicine, summarizing the study, reported that 16.9% of the nurses actually fell asleep at least once during a shift, and only 20.8% managed six or more hours of sleep. Nurses logged drowsy driving on roughly one in four shifts (26.1%). Most pointedly for anyone scheduling 12-hour rotations: the odds of a drowsy-driving episode doubled when a nurse worked 12.5 or more consecutive hours (OR = 2.00).
That study is from 2007, old enough that a careful reader should ask whether it still holds. More recent objective data says it does. James and James ran a controlled driving-simulator study, published in Nursing Reports in 2023, with 94 nurses split between night and day shift. Night-shift participants had collisions on 11% of their drives, against 7% for day-shift nurses, and showed significantly greater lane deviation and significantly more violent braking. The 2023 sample is small, so treat it as corroboration rather than headline. But it moves the finding off self-report and onto measured behavior behind a wheel, two decades after the original logbook study reached the same conclusion.
Shift length itself is part of the mechanism, and it links straight to attrition. In the RN4CAST study of 31,627 nurses across 488 hospitals in 12 European countries, Dall’Ora and colleagues found nurses working 12 hours or more had 40% higher odds of job dissatisfaction and 29% higher odds of reporting an intention to leave, compared with nurses on shifts of 8 hours or less (BMJ Open, 2015). The long shift that makes the drive home dangerous is the same long shift that correlates with the nurse deciding to quit. Commute risk and retention risk are not adjacent problems. They share a root cause.
So the obvious objection — nurses drive themselves, so why fund their transport? — has a data-backed answer. The status quo is two thirds of your nurses driving drowsy, four in five of your night nurses doing it, and the longest shifts doubling the risk on the exact campuses you most need to keep staffed.
The retention math: what one lost night-shift RN actually costs
Drowsy driving is the safety frame. Turnover is the dollars frame, and it is the one a CFO will fund against.
The most-cited industry benchmark comes from NSI Nursing Solutions, a nurse-recruitment firm, in its 2026 National Health Care Retention & RN Staffing Report. The publisher matters here: NSI sells recruiting services, the figures are self-reported hospital-survey aggregates rather than government statistics, and no federal equivalent of the per-RN turnover cost exists. With that disclosure, the report’s CY2025 numbers are the working benchmark the whole sector uses. It put the national RN turnover rate at 17.6%, up 1.2 points year over year, with a wide geographic spread in staff RN turnover from 5.6% to 40.0%. The average cost of turnover for a single bedside RN: $60,090. NSI estimated the average hospital loses between $4.2M and $6.2M a year to RN turnover, and that each one-percentage-point change in RN turnover costs or saves the average hospital about $295,000 annually.
Two more figures size the refill problem. The RN vacancy rate stood at 8.6%, with a third of hospitals (33.1%) reporting vacancies of 10% or higher, and the average time to recruit an experienced RN ran 78 days, NSI reported. Roughly two and a half months with a seat empty, then a $60,090 replacement cost when you fill it.
Now build the per-campus case. Take a five-campus system with 1,800 RNs and turnover at the national 17.6%. That is about 317 RNs lost in a year, or close to $19M in replacement cost at $60,090 each. The night shift is over-represented in that loss, because the night drive is the part of the job that wears people down fastest. A transport program does not have to move the headline turnover rate to pay for itself. Using NSI’s $295,000-per-point figure, shaving system-wide RN turnover by a single percentage point is worth $295,000 a year. If a schedule-matched night-run program at the two hardest-to-staff campuses retains even six night nurses who would otherwise have left, that is roughly $360,000 in avoided replacement cost — before counting the 78 days each of those seats would have sat open, the overtime and agency premiums to cover them, and the patient-safety risk of running short.
That is the calculation to take to finance. The transport line is small. The turnover line it offsets is not.
Inter-campus coordination: float pools, shared shuttles, and hub-and-spoke routing
Once the histograms exist for every campus, the routing question becomes tractable. A tempting shortcut is to give each campus its own dedicated shuttle and call it done. For a system, that doubles or octuples the fleet and still strands the float pool, whose whole job is to be somewhere different tomorrow.
A hub-and-spoke model usually routes a multi-campus roster more efficiently than parallel per-campus loops. Pick one or two park-and-ride hubs — often a large lot at the flagship campus, or a leased lot near a transit node — and run timed legs from each hub out to the campuses that need staff for the next shift change. Nurses park once, board a vehicle keyed to their reporting campus and shift, and ride a direct leg. The same vehicle that carries the 7p inbound to the satellite campus carries the 7a-relieved off-going crew back to the hub on its return.
The float pool is the case that breaks naive routing, so design for it first. A float nurse’s pickup point is stable (where she lives or parks) but her drop-off changes shift to shift. The dispatch logic has to read tonight’s roster assignment, not a fixed home-campus default. This is where schedule-matched dispatch earns its keep: rather than publishing a static timetable, the system reads the staffing roster and builds the night’s runs from where staff are actually assigned. When the staffing office moves a float nurse from Campus B to Campus D at 4pm, the 6:30pm pickup needs to route her to D.
Three coordination rules hold up across most multi-campus rollouts. Match dispatch windows per campus to that campus’s own comb, not to a system-wide average — a quiet ambulatory site and a Level I trauma flagship do not change shifts on the same clock. Size the inter-campus legs to the float pool plus the cross-site travelers, not to the fixed staff, since the fixed staff are already nearest their home campus. And keep at least one off-hour run alive on Sunday night and overnight, when public transit is thinnest and the 11p and 3a starts have no realistic alternative.
Ryde’s platform handles this class of problem by reading the roster and matching vehicle dispatch to real shift-change windows across sites, which is the capability a static shuttle timetable cannot provide. Systems running this kind of inter-campus coordination can see the pattern in the 24/7 healthcare operations case study.
Choosing a transport model: fixed shuttle, on-demand night runs, or subsidy
No single model wins across an entire system. The right answer is usually a blend, matched to the volume and timing at each campus. The fixed shuttle wins where volume is high and predictable; on-demand wins on the thin off-hour tail; a subsidy fills the gaps neither covers.
| Model | Best fit | Cost shape | Coverage of night/off-hour tail | Float-pool fit |
|---|---|---|---|---|
| Fixed-route shuttle | High-volume campus, dense 7a/7p comb | Per-vehicle, per-hour; fixed regardless of load | Poor unless you run near-empty late vehicles | Weak — static stops, fixed destinations |
| On-demand / scheduled night runs | Thin off-hour starts (11p, 3a), low-density sites | Per-trip; scales with actual demand | Strong — runs only when the roster needs it | Strong — routes to tonight's assigned campus |
| Commuter subsidy / stipend | Dispersed staff, no viable shared route | Per-employee; taxable to employee in the US | None — individual cars still drive drowsy | Neutral — does not address routing |
The pattern most multi-campus systems land on: fixed shuttles on the two or three densest legs at peak comb times, on-demand night runs for the off-hour tail and the lower-volume campuses, and a subsidy only as a backstop for staff no shared route can reach. The subsidy looks cheap on a spreadsheet, but note what it does not buy. A stipend puts the same tired nurse in the same car on the same drive home. It moves the cost off the facilities budget without touching the drowsy-driving risk or the night-shift retention problem the data flags.
For a fuller breakdown of how shared-vehicle programs price out against the parking and single-occupancy baseline, the shuttle versus parking cost analysis runs the comparison in detail, and the smart employee commuting overview covers the program structure.
A 90-day rollout for a multi-campus staff transport program
Do not launch system-wide. Nothing discredits a staff-transport program faster than rolling it out across eight campuses at once, getting the dispatch windows wrong on most of them, and watching utilization crater. Pilot narrow, instrument heavily, then scale what worked.
A workable sequence runs in three phases. In the first month, pick one campus and one roster — ideally the hardest-to-staff campus and its night shift, where the retention upside is largest and the alternative (an empty 7p-to-7a seat) is most expensive. Pull that campus’s scheduling export, build the shift-change histogram, and set initial dispatch windows on the two or three tallest teeth. Run it for the night roster only.
The second month is measurement and adjustment. Track who actually boards against who was scheduled, and move the windows to match real behavior rather than the plan. Survey the night nurses on the pilot directly: did they use it, would they have driven otherwise, do they feel safer. This is also when the float pool gets added, because by now the dispatch logic is reading the live roster and you can test whether it routes a reassigned nurse correctly.
The third month extends to a second campus and a day shift, proving the model handles a different comb and a higher-volume peak. By day 90 the system has two campuses, two shift types, and the float pool live, plus a clean dataset on utilization and cost per filled seat. That dataset is what justifies the system-wide build. A rollout that skips the pilot has no evidence to scale on; one that pilots well scales on numbers, not hope. The broader sequencing logic of getting a shuttle pilot to stick is covered in why shuttle pilots fail in week 6.
Metrics to watch after launch
A staff-transport program is easy to fund and easy to kill, because the people who decide its budget rarely ride it. Instrument it so the decision is made on data.
Four measures carry most of the signal. Night-shift fill rate at the pilot campus is the headline — if the program is working, the campus that struggled to staff 7p-to-7a should be staffing it more reliably, and that line connects directly to the $60,090-per-RN math. Ninety-day new-hire retention is the second, because the costliest turnover is the nurse who quits inside the first three months, and a reliable ride home is one of the few commute variables a system actually controls. Track utilization per dispatch window, not as a single system-wide average that hides the failures: a healthy program has full peak-comb runs and deliberately lighter off-hour runs, and averaging them together masks both. Finally, run a short periodic self-report on drowsy driving and near-misses among night staff, anchored to the Scott study’s questions, so the safety case stays measured rather than asserted.
One framing note on the safety metric. Self-reported near-misses will look alarming at baseline — that is the point, given two thirds of nurses report drowsy driving — and the goal is a downward trend among program riders, not a perfect number. Pair it with the fill-rate and retention lines so the program is judged on the outcomes it can move. The analytics and reporting capability covers how utilization-per-window and cost-per-seat data get pulled without hand-built spreadsheets.
Four mistakes that sink multi-campus staff transport
The failures repeat across systems, and all four are avoidable with the roster data the staffing office already holds.
Tuning to the office peak is the first and most common. A plan keyed to 9am and 5pm misses the 7a/7p nursing comb at both ends, runs nearly empty, and gets cut for low utilization — when the real problem was that it never aligned to the shift-change clock. Build from the histogram, not from a generic commute curve.
Ignoring the float pool is the second. A system that routes only fixed staff to their home campuses leaves the float, per-diem, and travel nurses — the very people who move between sites — without a workable ride, and those are often the hardest roles to retain. The dispatch logic has to read tonight’s assignment.
Running one route profile across unequal campuses is the third. A Level I trauma flagship and a low-acuity ambulatory site do not share a shift-change clock, a volume, or a transit baseline. A single timetable forced across both will over-serve one and strand the other. Match windows per campus.
Leaving the off-hour tail uncovered is the fourth, and the most expensive in retention terms. Sunday-night and overnight starts have the thinnest public-transit alternatives and the highest drowsy-driving risk on the way home. A program that covers the weekday peaks but goes dark for the 11p and 3a starts protects the shifts that were never the problem and abandons the ones that were.
Frequently asked questions
Do hospitals provide transportation for employees?
Many large health systems run staff shuttles, park-and-ride lots, or commuter programs, though coverage varies widely and is often built around daytime peaks rather than the 7p-to-7a nursing shift. The structural reason it is becoming more common is retention economics: with the average bedside RN turnover cost at $60,090 (2026 NSI National Health Care Retention Report) and a tight labor market, systems are reassessing transport as a retention lever rather than a perk. The harder question for a multi-campus system is not whether to offer transport but whether the vehicle schedule matches the roster’s real shift-change windows across every site.
Is it safe to drive home after a 12-hour night shift?
The evidence says it is a measurable risk. Scott and colleagues found that 79.5% of night-only hospital nurses reported at least one episode of drowsy driving, and that the odds of an episode doubled past 12.5 consecutive hours on the clock (SLEEP, 2007). A 2023 driving-simulator study in Nursing Reports corroborated it objectively, with night-shift nurses crashing on 11% of simulated drives versus 7% for day-shift nurses. The post-night-shift drive home is the single highest-risk part of the commute, which is why off-hour transport coverage matters more than weekday-peak coverage.
How much does nurse turnover cost a hospital?
The most-cited benchmark, from the nurse-recruitment firm NSI Nursing Solutions, puts the average cost of replacing one bedside RN at $60,090, with the average hospital losing $4.2M to $6.2M a year to RN turnover (2026 edition, CY2025 data). Because NSI is a recruiting vendor and the figures are self-reported hospital-survey aggregates, treat them as the industry working number rather than a government statistic — there is no federal equivalent.
How do hospitals handle staff who work at multiple campuses?
Float-pool, per-diem, and travel nurses rotate between sites within a system, which means their reporting location changes shift to shift while their home or parking point stays fixed. The routing approach that handles this reads the live staffing roster and builds each run from tonight’s actual assignments, rather than defaulting every nurse to a home campus. A hub-and-spoke model — park once at a hub, ride a timed leg to the assigned campus — usually routes a multi-campus roster more efficiently than giving each campus a separate dedicated loop.
What to do this week
Two actions move this from concept to decision. First, pull the scheduling export for your hardest-to-staff campus and bin every shift start and end into 30-minute buckets — the resulting comb tells you where the dispatch windows belong, and it almost never matches a 9-to-5 commute curve. Second, run the retention number for one campus: current RN turnover, the seats lost on nights, and what even a one-point improvement is worth at NSI’s $295,000-per-point figure. Those two artifacts — a real shift-change histogram and a per-campus turnover figure — are what a finance team needs to evaluate a staff-transport program on its merits.
The pattern underneath all of it: the vehicle has to follow the roster across every campus, and the night-shift drive home is the part of the commute most worth protecting. If you want to pressure-test a schedule-matched, multi-campus model against your own roster data, talk to the Ryde team about a single-campus night-shift pilot.
Sources
- Scott LD, et al. “The Use of Actigraphy to Estimate Sleep and Drowsy Driving in Hospital Staff Nurses.” SLEEP. https://pmc.ncbi.nlm.nih.gov/articles/PMC2276124/
- American Academy of Sleep Medicine. “Nurses Who Work Extended Shifts Are More Likely to Drive Drowsy.” https://aasm.org/journal-sleep-nurses-who-work-extended-shifts-feel-tired-on-the-job-and-get-little-sleep-are-more-likely-to-drive-drowsy/
- James SM, James L. “The Impact of 12 h Night Shifts on Nurses’ Driving Safety.” Nursing Reports, 2023. https://pmc.ncbi.nlm.nih.gov/articles/PMC10054033/
- NSI Nursing Solutions, Inc. “2026 National Health Care Retention & RN Staffing Report.” https://www.nsinursingsolutions.com/Documents/Library/NSI_National_Health_Care_Retention_Report.pdf
- American Hospital Association. “Fast Facts: U.S. Health Systems” (FY2022 Annual Survey). https://www.aha.org/system/files/media/file/2024/02/Fast-Facts-US-Health-Systems-Infographic-2024.pdf
- Dall’Ora C, et al. “Characteristics of shift work and their impact on employee performance and wellbeing: twelve-hour shifts.” BMJ Open, 2015 (RN4CAST). https://pmc.ncbi.nlm.nih.gov/articles/PMC4577950/
- American Nurses Association. “Nurse Schedules: Pros & Cons of 12-Hour Shifts.” https://www.nursingworld.org/content-hub/resources/workplace/nurse-schedules-12-hour-shifts/
- American Association of Colleges of Nursing. “Nursing Shortage Fact Sheet” (citing BLS Employment Projections, HRSA Health Workforce Analysis, NSSRN). https://www.aacnnursing.org/news-data/fact-sheets/nursing-shortage